
The Destroyer of Ignorance and Confusion – Aum Namo KAlarAtreya NamAhA (Source: Wikipedia, Devi Kalratri, Sanghasri, Kalighat, Kolkata, 2010)
By Jayant Kalawar, posted April 15th 2020
I posted my Jyotish model projections of the current Wuhan Virus pandemic in USA on April 6th. These were the key summary projections:
- The memes in social media may begin to see some positive shoots after April 7th and a little more after April 14th, but we may have to wait until after April 25th for clarity on how and when people would be able to go back to work and school.
- The active Wuhan Virus cases in USA may likely peak between April 18th and 25th. Sharp declines may follow between April 25th and May 9th.
- Wuhan Virus related deaths in USA are likely to peak some time between April 25th and May 7th.
In this update I am posting graphics showing Jyotish Model projections for Active USA cases and total USA Deaths (first two graphics), followed by actuals up to April 13th (next two graphics). If you go back to my April 6th post and compare to what I have posted here, you will notice I have not tweaked my model projections at all. I am not looking to track levels / numbers of Active cases with my Jyotish model. What I am interested in tracking is how well this Jyotish based model is able to predict when the Active cases peak and when the declines start in Active Cases in USA. I notice a beginning of a slow down in the Active cases graph. Your constructive comments and suggestions are welcome on this post are welcome.
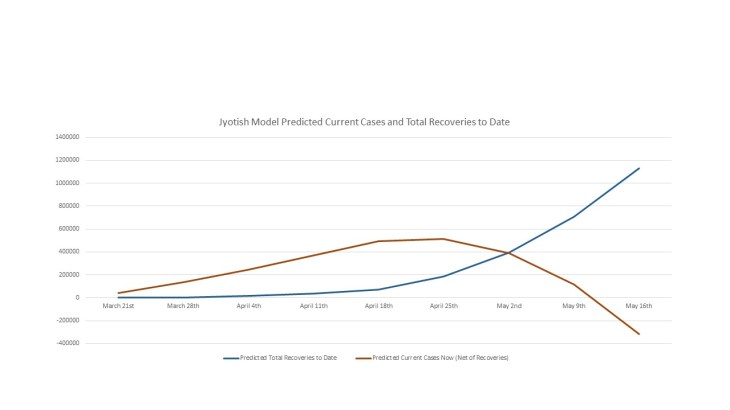
Jyotish Model Predicted Current Active Wuhan Virus Cases in USA March – May 2020

Jyotish Model Predicted Total Wuhan Virus Deaths in USA March – May 2020
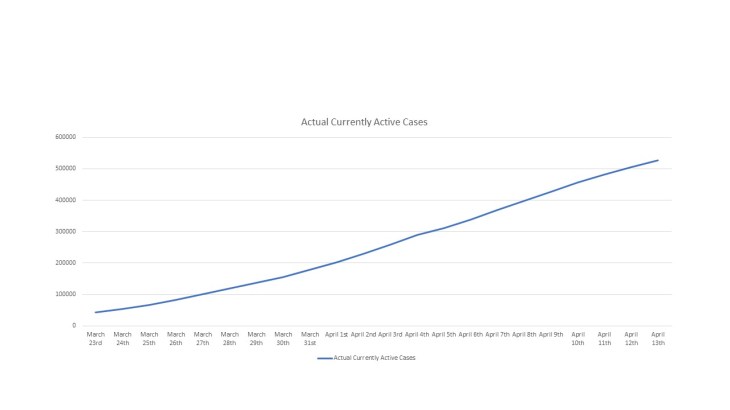
Actual Active Wuhan Virus Cases USA to April 13th 2020

Actual Total Wuhan Virus Deaths in USA to April 13th 2020
